Capture
What does the app actually send to the backend? The “ODataTailor” panel in DevTools records it – any Fiori, UI5 or other web app, without changing it. The workbench turns it into a picture.
- Where
- DevTools panel “ODataTailor”
- Detects
- OData V2 and V4, also parts inside $batch
- Storage
- in memory only, at most 500 requests
- Secrets
- redacted while recording, cookies dropped
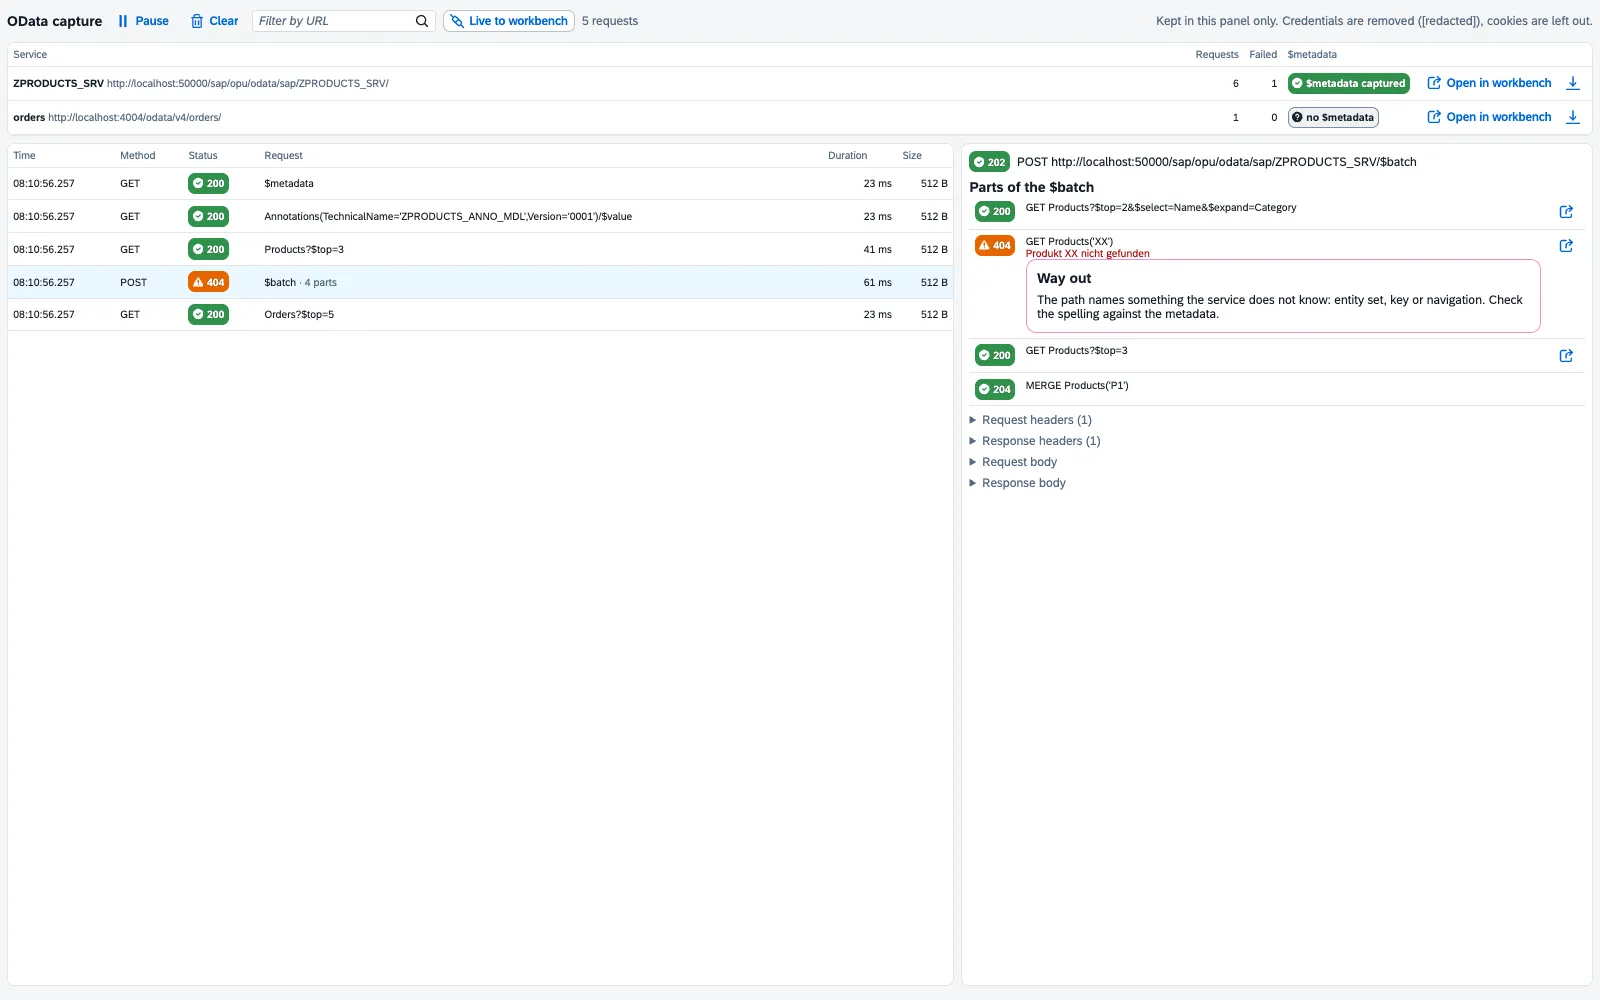
Record in the DevTools panel
- Open the app, open DevTools (F12) and choose the ODataTailor tab.
- The OData capture runs at once. Pause pauses, Record resumes, Clear starts over.
- Work in the app. On the left are the detected Services with the number of requests, failures and whether their
$metadatawas captured; on the right each request with method, status, duration and size. Parts of a$batchare listed one by one. - A click on a request shows headers and bodies. Filter by URL narrows the list.
Hand over to the workbench
- Open in workbench opens the service with the captured
$metadataand the calls. The app’s annotation files go along. - Query in workbench takes a single request into the Query tab – to reproduce and change it.
- Live to workbench keeps sending new calls over while you click in the app.
- Export saves the capture as a file (
.odtrace) or as data for the UI5 MockServer, optionally with anonymised texts.
Calls in the diagram
In the workbench the captured Calls appear above the diagram. “Previous call” and “Next call” step through them; the diagram highlights which types and navigations a call touches and which fields it loads, filters and sorts. Each call carries its role in the app: list, object page, value help, count, draft step, side effect.
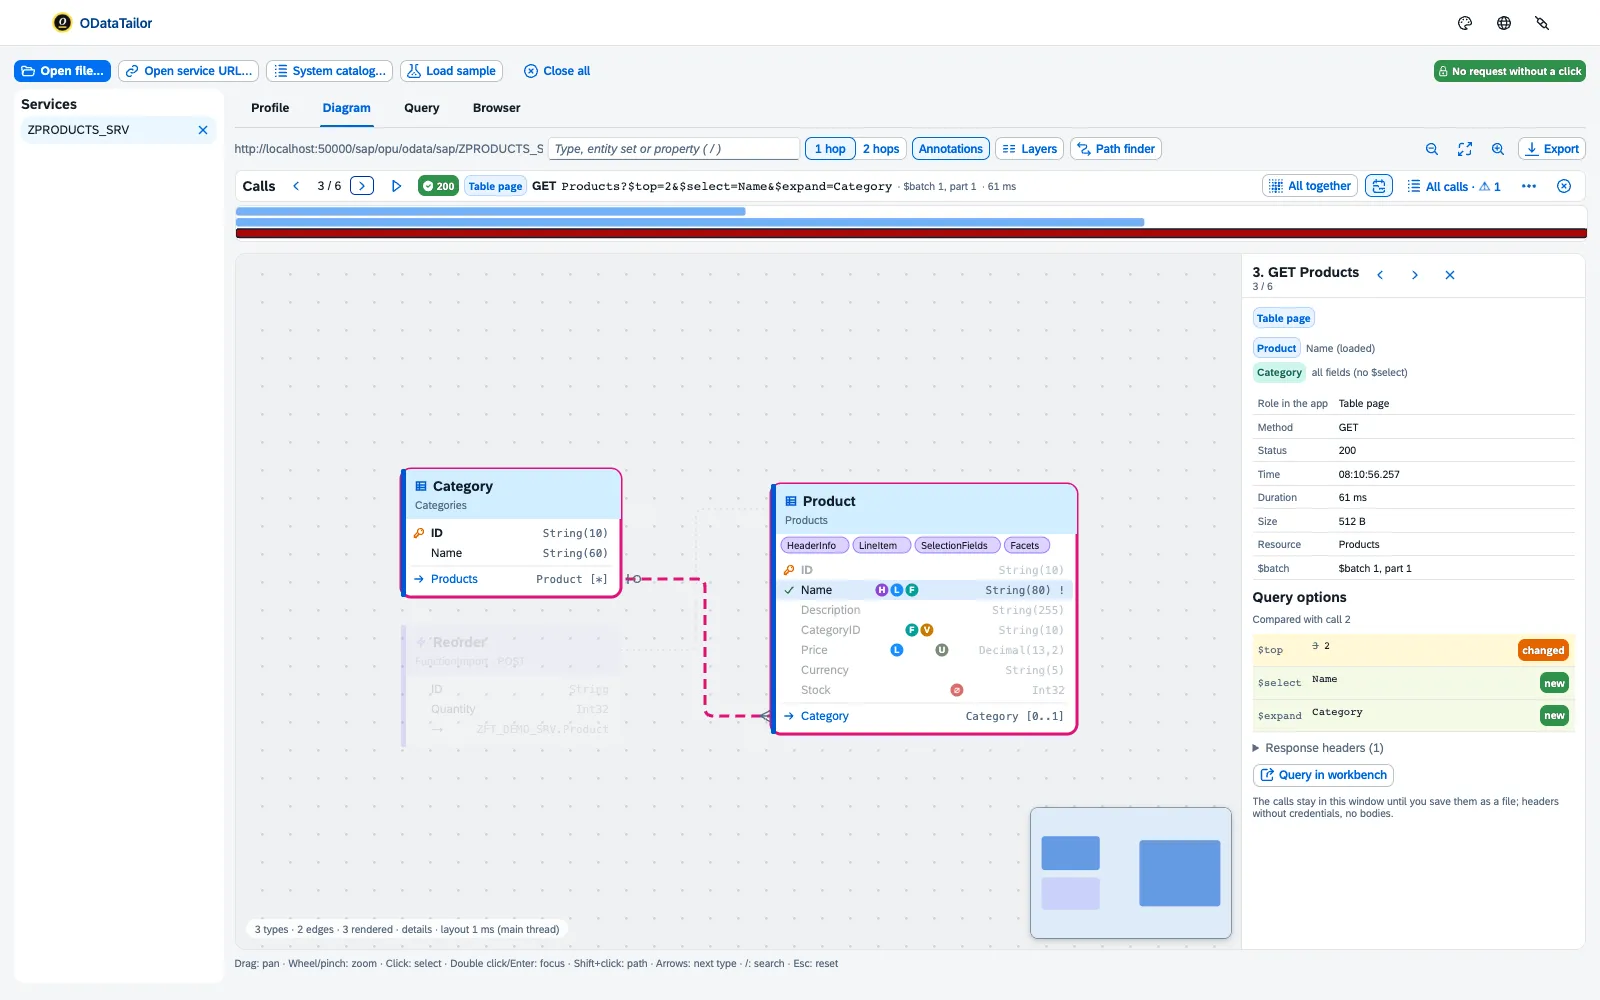
Play runs through the capture – step by step or at the pace of the app. Time line shows all calls as bars over time. Query in workbench puts a call into the query.
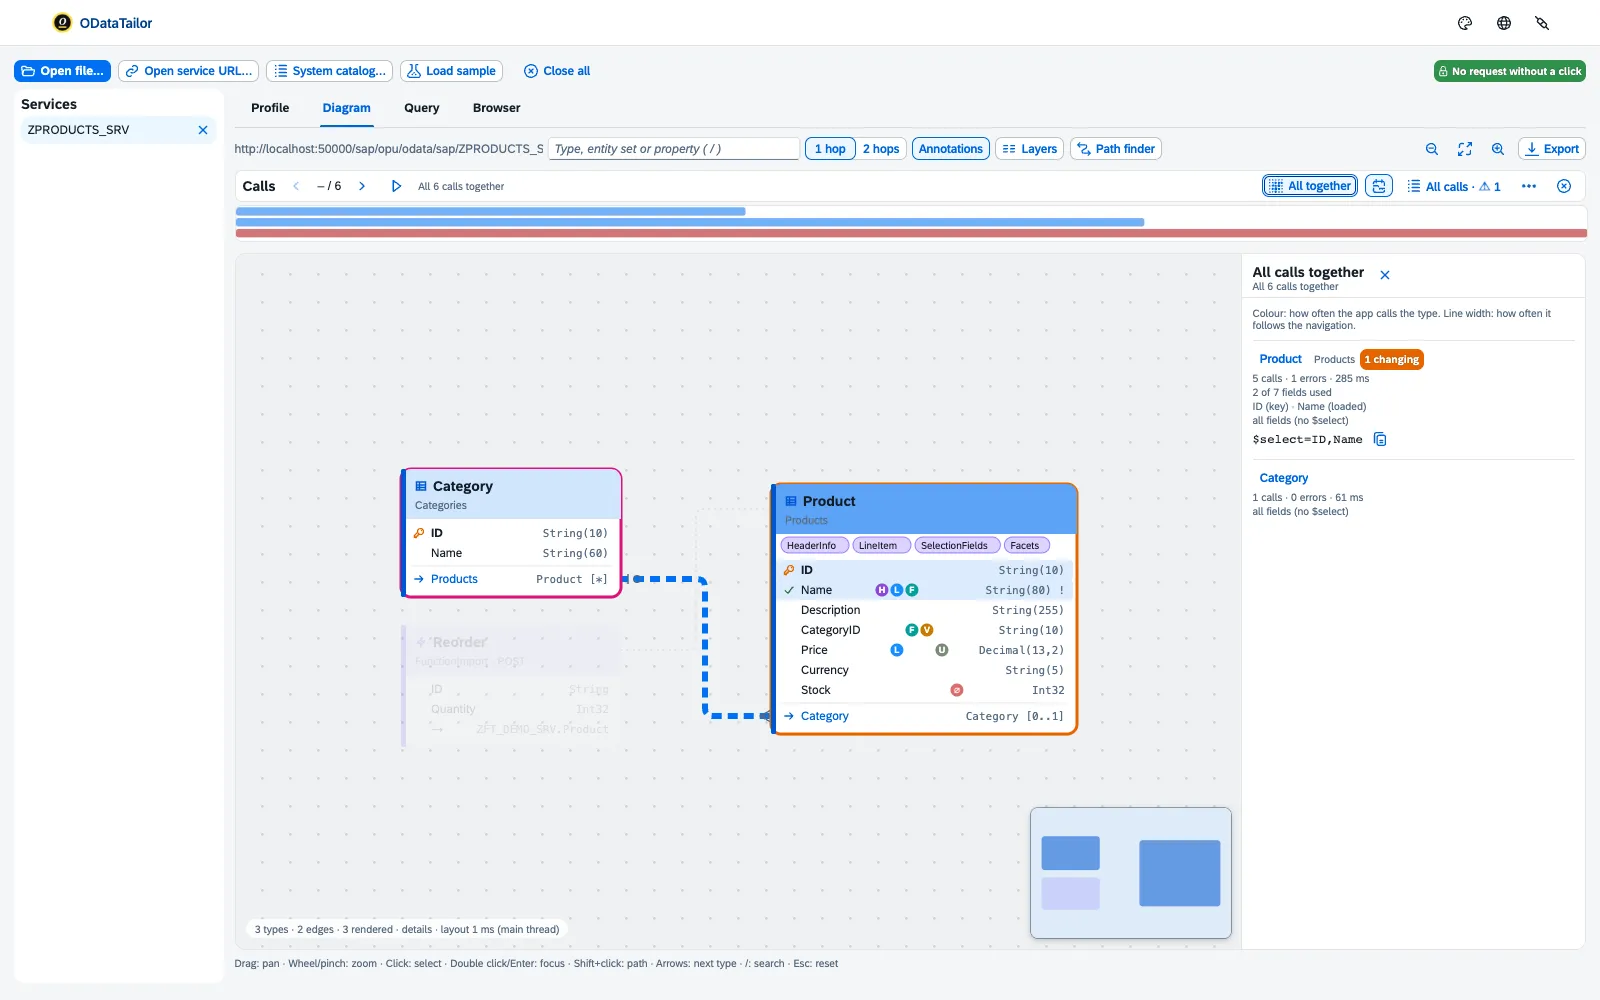
All together
All together lays all calls on top of each other: which types the app reads and changes, and how many of the loaded fields it uses – “18 of 64 fields used”. Fields that are loaded but shown nowhere according to the annotations are listed separately. Copy $select gives the field list that is really needed.
Better this way
The workbench spots patterns that cost time: the same call twice, a wide type without $select, many single reads by key, a navigation loaded after reading. Better this way suggests the replacement – one $filter instead of ten single reads, one call with $expand instead of three, only the fields in use.
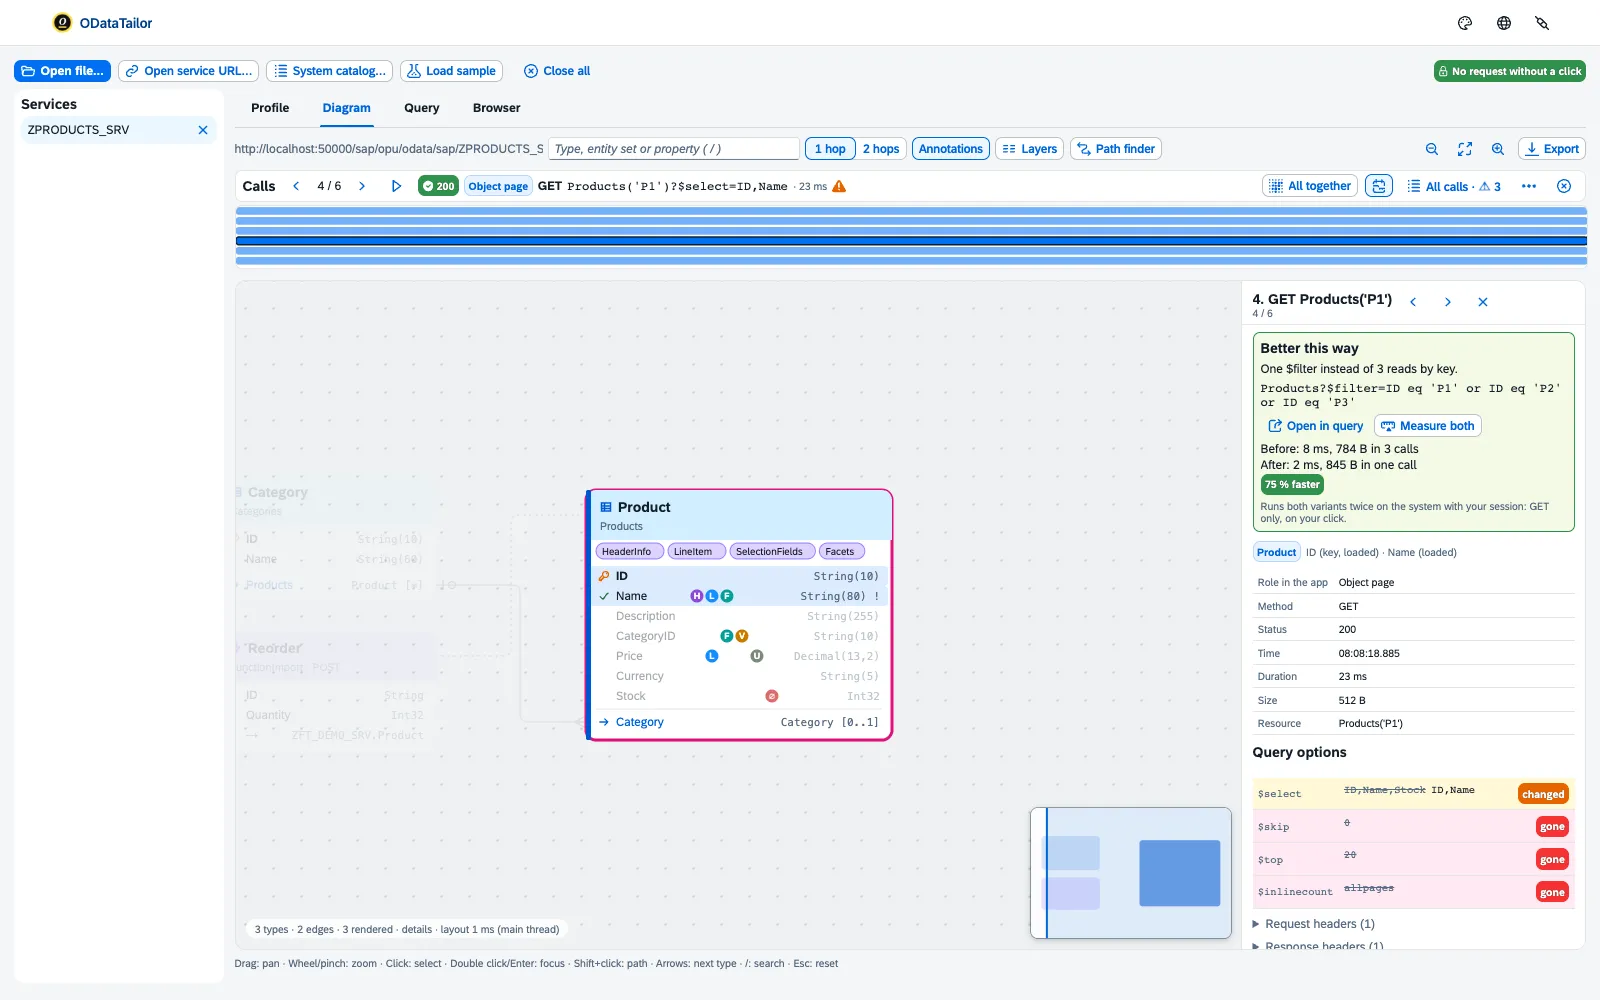
Measure both runs the old and the new variant and gives time, data and number of calls, before and after. Measuring only reads.
Save and compare captures
Save capture as file keeps a state – before an optimisation, say. Compare with capture file… sets two states side by side: calls, HTTP requests, time, data, changing calls and hints, plus each kind of call with new, gone, faster, slower. Save reads as requests turns the capture into a collection you can run on other systems.
See also
- Features at a glance Features · Capture
- Security Security and permissions
- Docs Querying
- Docs Collections, comparisons, errors
- Docs Permissions and privacy
- Sources Capture1 · Analysis2 · Redaction3 · FrontTailor4